Anomaly Detection Toolkit (ADTK)
Anomaly Detection Toolkit (ADTK) is a Python package for unsupervised / rule-based time series anomaly detection.
As the nature of anomaly varies over different cases, a model may not work universally for all anomaly detection problems. Choosing and combining detection algorithms (detectors), feature engineering methods (transformers), and ensemble methods (aggregators) properly is the key to build an effective anomaly detection model.
This package offers a set of common detectors, transformers and aggregators with unified APIs, as well as pipe classes that connect them together into a model. It also provides some functions to process and visualize time series and anomaly events.
Installation
Prerequisites: Python 3.5 or later.
It is recommended to install the most recent stable release of ADTK from PyPI.
$ pip install adtk
Alternatively, you could install from source code. This will give you the latest, but unstable, version of ADTK.
$ git clone https://github.com/arundo/adtk.git
$ cd adtk/
$ git checkout develop
$ pip install ./
Quick Start
In this example, we build a model to detect violation of seasonal (weekly and daily) traffic pattern. The data used here is the NYC taxi traffic dataset from Numenta Anomaly Benchmark.
Load and validate time series for training.
>>> import pandas as pd
>>> s_train = pd.read_csv("./training.csv", index_col="Datetime", parse_dates=True, squeeze=True)
>>> from adtk.data import validate_series
>>> s_train = validate_series(s_train)
>>> print(s_train)
Time
2014-07-01 00:00:00    10844
2014-07-01 00:30:00     8127
2014-07-01 01:00:00     6210
2014-07-01 01:30:00     4656
2014-07-01 02:00:00     3820
                       ...
2015-01-04 09:30:00     9284
2015-01-04 10:00:00    10955
2015-01-04 10:30:00    13348
2015-01-04 11:00:00    13517
2015-01-04 11:30:00    14443
Freq: 30T, Name: Traffic, Length: 9000, dtype: int64
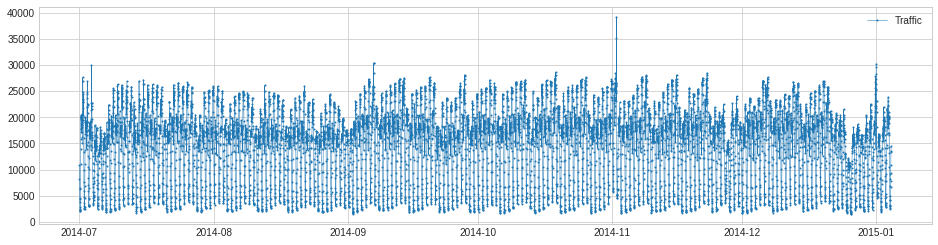
Visualize training time series.
>>> from adtk.visualization import plot
>>> plot(s_train)
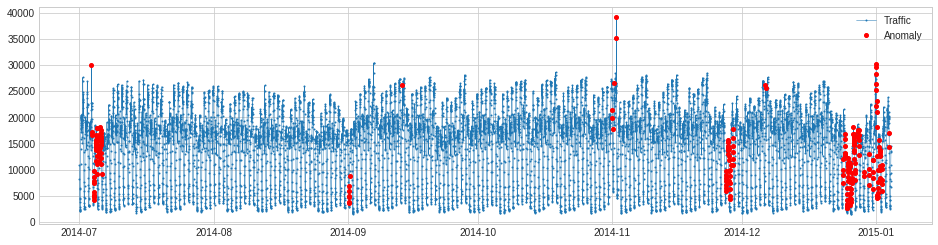
Detect violation of seasonal pattern.
>>> from adtk.detector import SeasonalAD
>>> seasonal_ad = SeasonalAD()
>>> anomalies = seasonal_ad.fit_detect(s_train)
>>> plot(s_train, anomaly=anomalies, anomaly_color="red", anomaly_tag="marker")
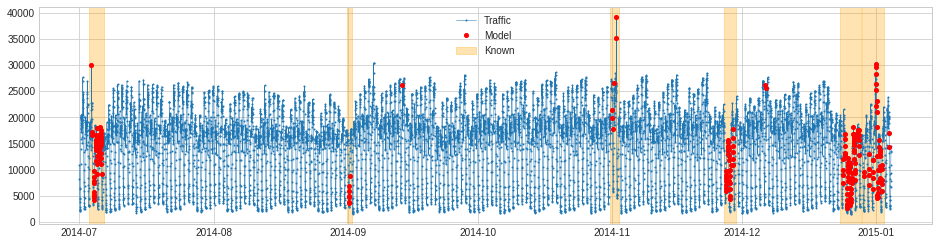
If known anomalies are available, cross check with detection results.
>>> known_anomalies = pd.read_csv("./known_anomalies.csv", index_col="Datetime", parse_dates=True, squeeze=True)
>>> from adtk.data import to_events
>>> known_anomalies = to_events(known_anomalies)
>>> print(known_anomalies)
[(Timestamp('2014-07-03 07:00:00', freq='30T'),
  Timestamp('2014-07-06 14:59:59.999999999', freq='30T')),
 (Timestamp('2014-08-31 18:30:00', freq='30T'),
  Timestamp('2014-09-01 21:59:59.999999999', freq='30T')),
 (Timestamp('2014-10-31 14:30:00', freq='30T'),
  Timestamp('2014-11-02 13:59:59.999999999', freq='30T')),
 (Timestamp('2014-11-26 19:00:00', freq='30T'),
  Timestamp('2014-11-29 14:29:59.999999999', freq='30T')),
 (Timestamp('2014-12-23 19:00:00', freq='30T'),
  Timestamp('2014-12-28 13:59:59.999999999', freq='30T')),
 (Timestamp('2014-12-28 19:30:00', freq='30T'),
  Timestamp('2015-01-02 21:29:59.999999999', freq='30T'))]
>>> plot(s_train,
         anomaly={"Known": known_anomalies, "Model": anomalies},
         anomaly_tag={"Known": "span", "Model": "marker"},
         anomaly_color={"Known": "orange", "Model": "red"})
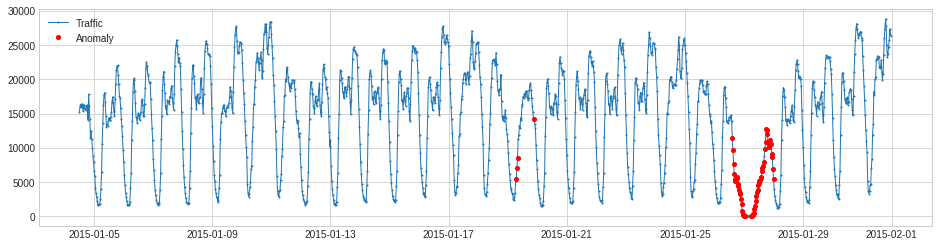
Apply the trained model to new data.
>>> s_test = pd.read_csv("./testing.csv", index_col="Datetime", parse_dates=True, squeeze=True)
>>> s_test = validate_series(s_test)
>>> print(s_test)
Datetime
2015-01-04 12:00:00    15285
2015-01-04 12:30:00    16028
2015-01-04 13:00:00    16329
2015-01-04 13:30:00    15891
2015-01-04 14:00:00    15960
                       ...
2015-01-31 21:30:00    24670
2015-01-31 22:00:00    25721
2015-01-31 22:30:00    27309
2015-01-31 23:00:00    26591
2015-01-31 23:30:00    26288
Freq: 30T, Name: Traffic, Length: 1320, dtype: int64
>>> anomalies_pred = seasonal_ad.detect(s_test)
>>> plot(s_test, anomaly=anomalies_pred,
         ts_linewidth=1, anomaly_color='red', anomaly_tag="marker")
For more examples, please check Examples. But before that, we recommend you to read User Guide first.
Table of Contents